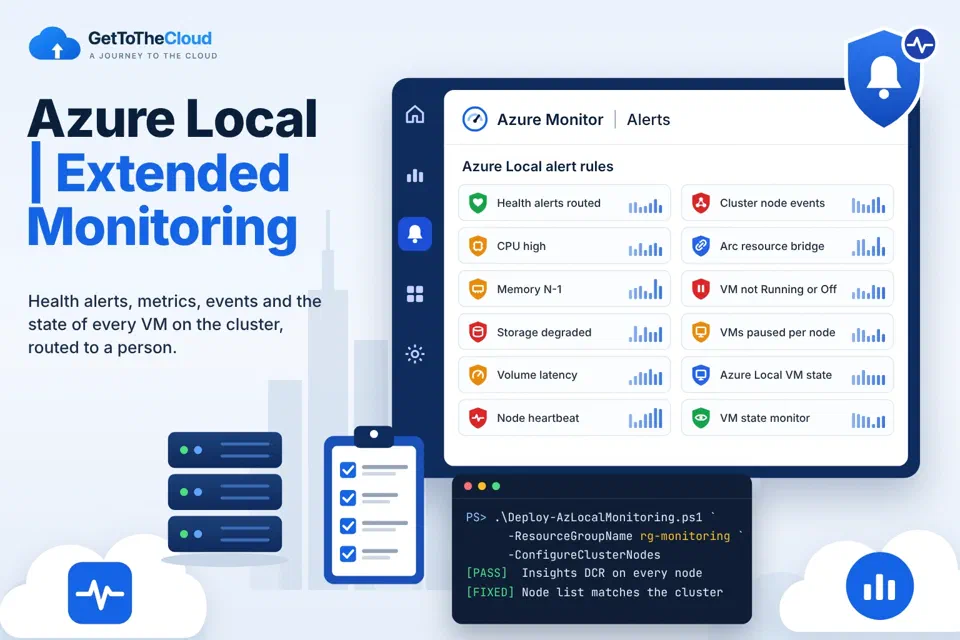
Azure Local | Extended Monitoring
 Alex ter Neuzen
On this page
A green cluster in the Azure portal tells you surprisingly little.
It tells you the cluster talked to Azure recently. It does not tell you that a drive dropped out of the pool at three in the morning, that your nodes carry more memory than the cluster can absorb when one of them goes into maintenance, or that a VM has been sitting in Paused-Critical since its volume filled up.
Azure Local has most of the signals you need for that. Health alerts, platform metrics, Insights and Resource Health are all there, and most of them cost nothing. The problem is that each one is switched on in a different place, each one alerts on something different, and none of them reaches a person by default. And the VMs you created in Hyper-V Manager or Failover Cluster Manager instead of through Azure do not exist as far as Azure Monitor is concerned.
So I built a baseline for it: a Bicep template that deploys the alerting around one or more Azure Local clusters, three small scripts for the cluster side, and a deployment script that checks every prerequisite, fixes what it can and only then deploys. This post explains the design choices behind it, so you can decide what to keep and what to change.
Four signals, four jobs#
Before writing a single alert rule it helps to be clear about what each monitoring mechanism in Azure Local is good at.
| Signal | What it catches | Cost and latency |
|---|---|---|
| Health alerts | 80+ Health Service faults: drives, pool and volume capacity, NICs, storage QoS, VMs and VHDs | Free, near real time |
| Platform metrics | 60+ metrics for nodes, drives, volumes, NICs, VHDs and VMs | Free, near real time, kept 93 days |
| Insights | Health Service and SDDC Management events in Log Analytics, plus the Insights workbooks | Ingestion cost, 15 minutes or more |
| Resource Health | Availability of Azure resources such as the Arc resource bridge | Free |
Health alerts come from the AzureEdgeAlerts extension that the portal installs when you switch them on. Platform metrics come from the AzureEdgeTelemetryAndDiagnostics extension, which Azure manages for you. Insights uses the Azure Monitor Agent and a data collection rule (DCR) whose name starts with AzureStackHCI-.
The rule I follow is simple: page on health alerts and metric alerts, and use Log Analytics for everything that needs a query. Microsoft says the same in its own documentation. Insights is not recommended for high severity alerts, because collecting the logs can take 15 minutes.
Health alerts have no alert rule#
This is the part that surprises people. When you turn on health alerts, faults from the on-premises Health Service show up in the Alerts blade of the cluster. But there is no alert rule behind them, so there is nowhere to attach an action group.
The only way to get them to a person is an alert processing rule scoped to the cluster resource. This is the core of it in the template:
resource clusterRouting 'Microsoft.AlertsManagement/actionRules@2021-08-08' = {
  name: '${namePrefix}-apr-cluster-routing'
  location: 'global'
  properties: {
    enabled: true
    scopes: clusterIds
    conditions: [
      { field: 'Severity', operator: 'Equals', values: routedSeverities }
    ]
    actions: [
      { actionType: 'AddActionGroups', actionGroupIds: [ actionGroupId ] }
    ]
  }
}
Every alert that targets one of the clusters now reaches the action group, whatever created it.
That has a consequence for the metric alerts. They target the same cluster resource, so if they had their own action group as well, every metric alert would arrive twice. In this template the metric alert rules deliberately have no action group. One routing path for everything on the cluster, and one place to change it when the storage team wants its own mailbox.
The thresholds of the Health Service itself, such as volume capacity, live on the cluster and not in Azure. The package contains Set-AzLocalHealthSettings.ps1 for that. It sets the volume capacity thresholds (Microsoft’s defaults are 80 and 90 percent) and enables the physical disk tail latency fault, which is disabled by default:
Get-StorageSubSystem Cluster* | Set-StorageHealthSetting `
    -Name 'System.Storage.PhysicalDisk.HighLatency.Threshold.Tail.Enabled' `
    -Value 'True'
A slow drive that drags a whole mirror down is exactly the kind of fault you want to hear about before your users do.
Metric alerts that follow how a cluster fails#
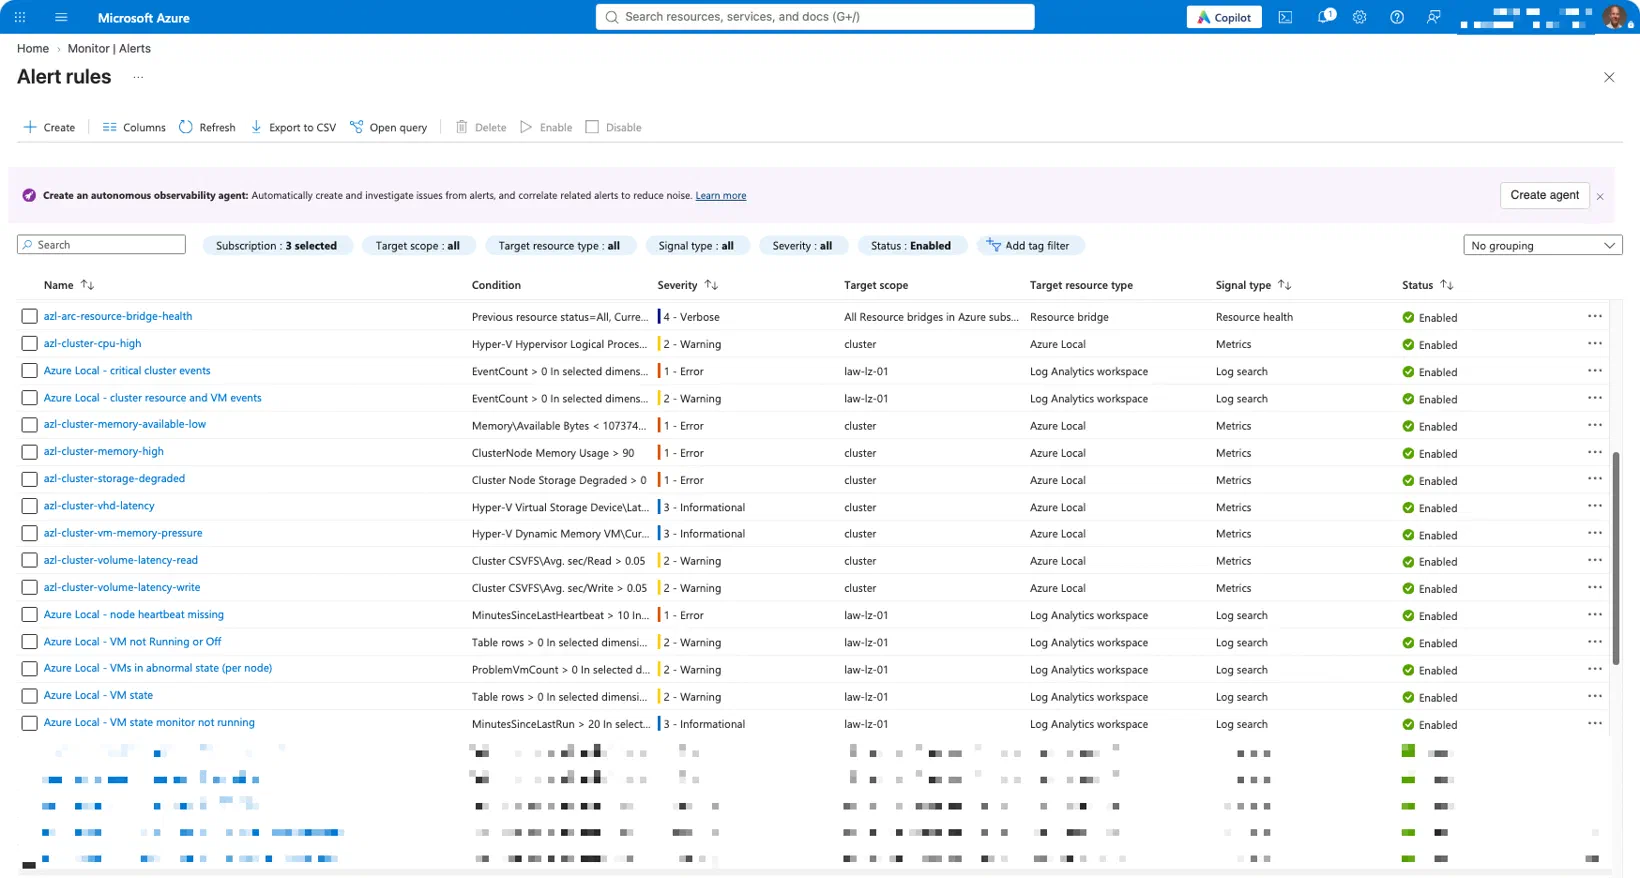
The recommended alert rules for Azure Local are a reasonable start: CPU above 80 percent, available memory below 1 GB, and volume latency above 500 milliseconds. I kept the idea and changed most of the numbers.
| Rule | Metric | Default |
|---|---|---|
| CPU high | Hyper-V Hypervisor Logical Processor\% Total Run Time | 85% over 15 minutes |
| Memory high | ClusterNode Memory Usage | 90% |
| Memory N-1 | ClusterNode Memory Usage | (N-1)/N x 100 over 1 hour |
| Available memory | Memory\Available Bytes | 1 GB |
| Storage degraded | Cluster Node Storage Degraded | above 0 |
| Volume latency | Cluster CSVFS\Avg. sec/Read and Avg. sec/Write | 50 ms |
| VHD latency | Hyper-V Virtual Storage Device\Latency | 100 ms |
| VM memory pressure | Hyper-V Dynamic Memory VM\Current Pressure | 100% |
The N-1 rule is the one I would not want to run without.
A two-node cluster that runs both nodes at 65 percent memory looks perfectly healthy. Until you drain one node for the monthly update and the VMs have nowhere to go. The template calculates the threshold from the number of nodes: 50 percent for two nodes, 66 for three, 75 for four. It is a warning with a one-hour window, not a page, because it is about capacity and not about something that is broken right now.
Your cluster is only as big as what is left when one node is gone.
The latency rules need one detail. The Azure Local metrics report latency in seconds, and Bicep has no decimal literals. The template takes milliseconds as a parameter and converts them with json(). In essence:
var ms = thresholds.volumeLatencyMs
var fraction = padLeft(string(ms % 1000), 3, '0')
var volumeLatencySeconds = json('${ms / 1000}.${fraction}')
A value of 50 becomes 0.050. The recommended 500 milliseconds is a lot of latency for SQL Server or a VDI host, so 50 is a better starting point for an all-flash cluster. Tune it to what your storage normally does.
Events that matter, in their own data collection rule#
Some things only show up in the Windows event log of the nodes: a node that drops out of cluster membership, a lost quorum, a Cluster Shared Volume that pauses on I/O timeouts. Insights does not collect those. It collects the Microsoft-Windows-Health/Operational and Microsoft-Windows-SDDC-Management/Operational channels.
Tempting as it is, I do not touch the Insights DCR. Microsoft strongly recommends against creating your own DCR for Insights, because the one Insights creates contains a special data stream, and a changed DCR is one of the things that puts “Needs update” on the Insights tile. The Azure Monitor Agent supports more than one DCR per machine, so the template creates a second one and associates it with every node:
dataSources: {
  windowsEventLogs: [
    {
      name: 'azureLocalClusterEvents'
      streams: [ 'Microsoft-Event' ]
      xPathQueries: xPathQueries
    }
  ]
}
The xPathQueries are built from the event ID parameters: one query on the System log, filtered on the Microsoft-Windows-FailoverClustering provider, and one on the Microsoft-Windows-Hyper-V-Worker-Admin channel.
Two log search alerts sit on top of it:
| Severity | Event IDs | Meaning |
|---|---|---|
| Sev1 | 1135, 1177, 5120, 5142 | Node removed from membership, quorum lost, CSV paused or no longer accessible |
| Sev2 | 1069, 1205, 1254, 18590 | Cluster resource or role failed, failover threshold exceeded, guest OS crash |
Both alerts are stateful and split by node and event ID. One event gives one notification, and the alert resolves on its own 25 to 30 minutes later: the event first has to leave the 15-minute window, and then the rule wants three clean evaluations. The event IDs are parameters, so add the ones you care about. Check 18590 on your own nodes before you rely on it.
A node that disappears completely#
The node heartbeat alert has a small trick in it. A classic heartbeat query looks for the last heartbeat per computer. That works fine until a node has been gone long enough to drop out of the query window. Then it is not late, it is missing, and the query simply returns nothing for it.
The template passes the node list into the query and joins the heartbeats onto that list:
let expectedNodes = dynamic(['node01', 'node02']);
let lastSeen = Heartbeat
    | extend NodeName = tolower(tostring(split(Computer, ".")[0]))
    | where NodeName in (expectedNodes)
    | summarize LastHeartbeat = max(TimeGenerated) by NodeName;
print NodeName = expectedNodes
| mv-expand NodeName to typeof(string)
| join kind=leftouter lastSeen on NodeName
| extend MinutesSinceLastHeartbeat = iff(isnull(LastHeartbeat), long(9999),
    datetime_diff('minute', now(), LastHeartbeat))
A node without any heartbeat in the window gets 9999 minutes and fires like any other silent node.
The Arc resource bridge#
The last infrastructure alert is a Resource Health alert on the Arc resource bridge. When the bridge is unavailable you cannot manage your Azure Local VMs from Azure. Microsoft is also clear that the bridge must not be offline for more than 45 days, because its security key can expire and cannot be refreshed after that.
That is not something you want to discover on day 46.
What about the VMs?#
This is the question that started the second half of the template. You can monitor a cluster perfectly and still miss that a VM has been paused for two hours. The answer depends on what kind of VM it is.
Azure Local VMs: ask Resource Graph#
VMs created through Azure (Microsoft.AzureStackHCI/virtualMachineInstances) report their power state, provisioning state and guest agent status to Azure. A log search alert can query Azure Resource Graph through arg(""). Simplified, the query looks like this:
arg("").Resources
| where type =~ 'microsoft.azurestackhci/virtualmachineinstances'
| extend vmName = tolower(tostring(split(id, '/')[8]))
| extend powerState = tostring(properties.status.powerState),
         provisioningState = tostring(properties.provisioningState)
| where provisioningState =~ 'Failed'
    or powerState in~ ('Stopped', 'Unknown', 'Paused', 'Saved')
A Resource Graph query in a log search alert requires a managed identity. This rule uses the same identity as every other log search alert in the template (more on that below), which has Reader on the cluster resource group. One identity supports up to 50 Resource Graph rules, and cross-service queries return at most 1,000 rows, which is plenty for one cluster resource group.
Run the query in Resource Graph Explorer first (without the arg(""). prefix) and check which properties your VMs actually report.
Every VM on the host: not the event log#
My first instinct for all the other VMs was the event log. Hyper-V and failover clustering log a lot. But they log transitions: a VM was turned off, a role failed, a guest crashed. Nothing writes an event that says “this VM has been in Saved for 40 minutes”. For a state you need something that looks at the current state.
There are two sources for that, and the template uses both.
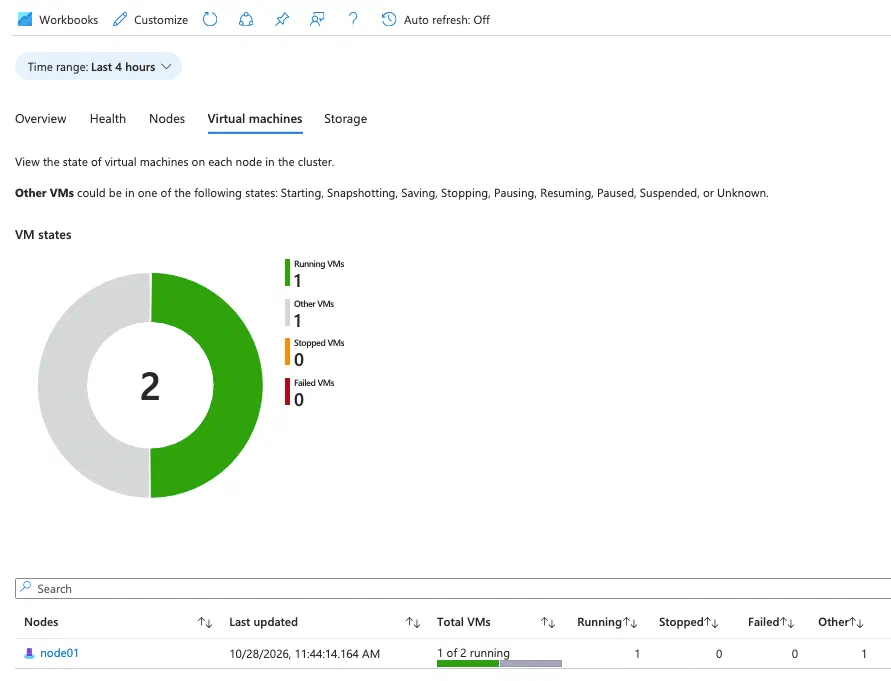
The first one is already in your workspace. The SDDC Management resource on the cluster writes event 3000 to Microsoft-Windows-SDDC-Management/Operational on a fixed interval. Its payload is JSON with, per node, the number of VMs in each state: running, stopped, failed, paused, suspended, unknown and the transitional states. The Virtual machines tab in Insights is built on the same data. One query turns it into an alert per node (simplified):
Event
| where EventLog == "Microsoft-Windows-SDDC-Management/Operational"
| where EventID == 3000
| extend payload = parse_json(RenderedDescription)
| mv-expand server = payload.m_servers
| extend NodeName = tolower(tostring(split(tostring(server.m_name), ".")[0]))
| extend vm = server.m_vm
| summarize arg_max(TimeGenerated, vm) by NodeName
| extend ProblemVmCount = toint(vm.m_totalVmsFailed)
    + toint(vm.m_totalVmsPaused) + toint(vm.m_totalVmsSuspended)
    + toint(vm.m_totalVmsUnknown)
No installation needed, but two limitations. You get counts, not VM names. And the data is only as fresh as the SDDC cache dump interval, which is one hour by default. Set-AzLocalHealthSettings.ps1 lowers it to 15 minutes, the lowest value Microsoft recommends:
Get-ClusterResource 'SDDC Management' |
    Set-ClusterParameter -Name CacheDumpIntervalInSeconds -Value 900
The second source gives you the names. Watch-AzLocalVmState.ps1 runs as a clustered scheduled task with -TaskType ClusterWide, so it runs on every node, every five minutes. Each node only looks at its own VMs with Get-VM and at the cluster roles it owns. That means no remoting, no VM reported twice, and VMs that are not clustered at all are covered too. Anything that is not Running or Off, and any VM role in Failed, PartialOnline or Pending, is written to the Application log as JSON:
$message = $problem | ConvertTo-Json -Compress
Write-EventLog -LogName Application -Source $EventSource `
    -EventId 4101 -EntryType Warning -Message $message
A VM has to be in a bad state in two samples a minute apart before it is reported. A normal start, stop or live migration does not page anybody. A VM that is stuck in Stopping does. The supplemental DCR picks up the events and the alert splits on VM name and problem, so the notification tells you which VM and what is wrong with it.
There is one more alert in this group, and it watches the watcher. Every run writes summary event 4100. When a node stops writing those, the “VM state monitor not running” alert fires. It waits until a node has been silent for twenty minutes and evaluates every fifteen, so a stopped task is reported 21 to 35 minutes after its last run. One missed run is not worth a mail.
A monitoring script that fails silently is worse than no script at all.
The task runs as SYSTEM. Clustered scheduled tasks always do, so there is no service account or password to manage. Setting it up takes one script on one node of the cluster; the steps are further down in this post.
Written for Application Control#
New Azure Local deployments run Application Control in Enforced mode. Microsoft’s base policy currently has script enforcement disabled, but a stricter policy of your own can put unsigned PowerShell in Constrained Language Mode. I did not want the cluster-side scripts to break the day someone tightens that policy, so they stick to cmdlets, hashtables and strings: no .NET method calls outside the allowed types, no classes, no Add-Type. They also use a -DryRun switch instead of SupportsShouldProcess. If you prefer to run them fully trusted, sign them with a certificate your policy allows.
One identity for every log search alert#
Every log search alert in this template runs its query as the same user-assigned managed identity, azl-id-alert-rules. That was not the first design. In the first version only the Resource Graph rule had an identity, because Azure requires one there. The others ran the way a log search alert without an identity always runs: with the permissions of the user who last saved the rule.
That sounds harmless until you think about who that user is. The account that ran the deployment, possibly through a PIM activation that expires an hour later. A colleague who leaves. A pipeline service principal that gets replaced. The rule keeps showing Enabled, and nothing tells you it can no longer read the workspace.
In my lab that was not a theory. I paused a test VM, and the task wrote its event 4101 every five minutes. The event was in the workspace, and the query of the rule returned the paused VM. The rule was Enabled, its history stayed empty, Resource health said Unknown, and no mail came. I cannot prove which permission was missing. But the data, the query and the action group stayed the same. Only two things changed: the rule got the managed identity, and the deployment saved it again. Twenty-six minutes after that deployment, the first alert fired.
Microsoft recommends a managed identity for exactly this reason. The template creates one and gives it two roles:
| Role | Scope | Why |
|---|---|---|
| Log Analytics Reader | Workspace | Every log search alert queries it |
| Reader | Cluster resource group | Resource Graph only returns what the identity can read |
Each rule then references the identity:
identity: {
  type: 'UserAssigned'
  userAssignedIdentities: {
    '${identityId}': {}
  }
}
One identity instead of one per rule means two role assignments instead of a dozen.
The deployment that said no#
My first version put the identity, its two role assignments and the rules in one deployment. The rules had a dependsOn on the role assignments, and skipQueryValidation: true so Azure would not try to run the queries while saving them. It looked careful. Every rule deployment failed anyway:
The provided credentials have insufficient access to perform the requested operation
(Code:BadRequest)
The credentials in that message are not yours. They belong to the identity of the rule. When a log search alert rule is saved, the alert service checks whether that identity can reach the workspace, and skipQueryValidation does not switch that check off. dependsOn only guarantees that the role assignment exists in Azure Resource Manager. It says nothing about when other services act on it, and Microsoft documents that a new role assignment can take up to ten minutes to take effect. A role assignment of twenty seconds old does not count yet.
There is no Bicep property that waits ten minutes, so the deploy script deploys in two phases when the identity or its roles are new:
| Phase | What | Time |
|---|---|---|
| 1 | Everything except the log search alert rules, including the identity and its roles | 2 to 4 minutes |
| Wait | Until the newest role assignment is five minutes old | about 5 minutes |
| 2 | The full template, including the rules. On “insufficient access” it tries twice more, three minutes apart | 2 to 4 minutes |
So a first deployment takes ten to fifteen minutes. On every run after that, the identity and its roles already exist, and the script skips phase 1 and the wait. The template has a parameter for phase 1, deployLogAlertRules, so you can do the same with az deployment group create if you deploy without the script.
The rules still skip query validation, but that now only means the syntax check. The test procedure at the end of this post covers what that check would have caught.
Maintenance windows#
Patch night produces exactly the events this template alerts on. Nodes leave and join the cluster, roles move, VMs pause during live migration. An optional weekly maintenance window adds alert processing rules with RemoveAllActionGroups. That action wins over every action group, including the ones on the alert rules themselves. The alerts are still created, so you can review them in the morning. Only the notifications are suppressed.
Deploy-AzLocalMonitoring.ps1: check, fix, then deploy#
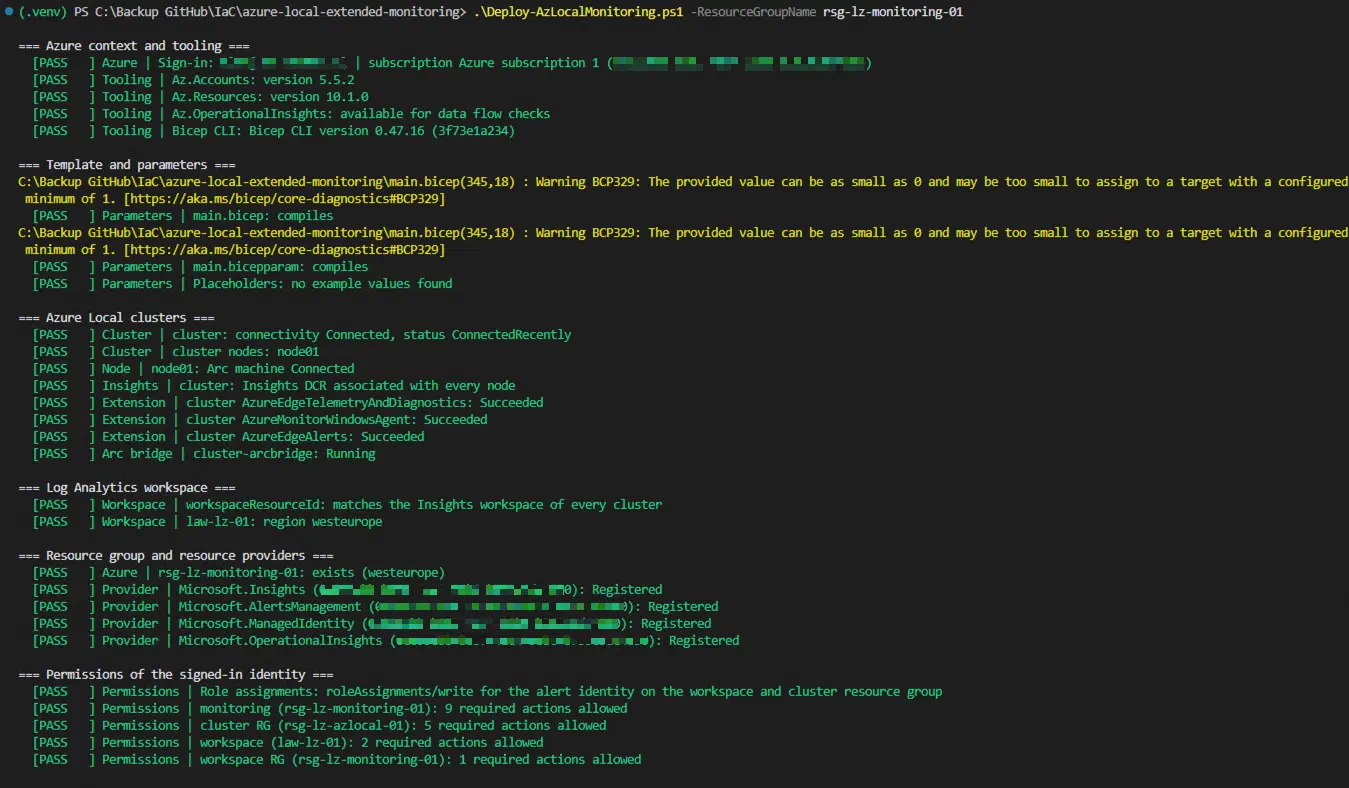
Every prerequisite in this post is something that can be wrong in a real environment. Insights enabled on two clusters out of three. Health alerts never switched on. A node added last month that is not in the parameter file. A colleague without permission to create role assignments.
I did not want a README with a checklist. Deploy-AzLocalMonitoring.ps1 runs every check, fixes what can be fixed safely, shows an Azure what-if and only deploys when nothing has failed:
Connect-AzAccount
.\Deploy-AzLocalMonitoring.ps1 -ResourceGroupName rg-azlocal-monitoring -WhatIf

.\Deploy-AzLocalMonitoring.ps1 `
    -ResourceGroupName rg-azlocal-monitoring `
    -ConfigureClusterNodes `
    -NodeDnsSuffix corp.contoso.com
The first run with -WhatIf changes nothing. The second one fixes, deploys after you confirm the what-if, and with -ConfigureClusterNodes also applies the Health Service settings and registers the VM state task over PowerShell remoting. Without remoting you do that part by hand on one node, which I describe below. The first real deployment takes ten to fifteen minutes, because of the two phases described above.
These are the things it fixes on its own:
- A node list that differs from the nodes the cluster reports: it deploys with the cluster’s list.
- A
workspaceResourceIdthat is not the Insights workspace: it uses the Insights workspace, as long as every cluster uses the same one. - A missing Azure Monitor Agent or health alerts extension: Bicep installs it, only on the clusters that miss it.
- A missing monitoring resource group or unregistered resource providers.
- No right to create role assignments: the alert identity is deployed without its roles, and the script prints the
New-AzRoleAssignmentcommands for someone who does have the rights. It then stops before the log search alert rules, because the alert service would reject them anyway. Run the script again once the roles are in place.
The health alerts extension needs a closer look. Its publisher and type are not documented, so I could not hard-code them in the template. The script reads them from a cluster that already has health alerts and uses them for the clusters that do not. Switching health alerts on once in the portal is enough.
What it refuses to fix is Insights itself. Recreating the Insights DCR by hand is exactly what Microsoft tells you not to do. When a node has no Insights DCR, the script stops and tells you where to switch Insights on.
The permission check deserves a mention. Reading role assignments misses group membership and activated PIM roles, so the script asks Azure for the effective permissions of the signed-in identity on each scope instead:
$path = "$Scope/providers/Microsoft.Authorization/permissions"
Invoke-AzRestMethod -Method GET -Path "$($path)?api-version=2022-04-01"
It then checks the exact actions the deployment needs, depending on which parts of the template are switched on. For example Microsoft.Insights/scheduledQueryRules/write on the monitoring resource group and Microsoft.Insights/dataCollectionRuleAssociations/write on the cluster resource group. Deny assignments are not part of that check, so a deny assignment can still stop the deployment.
Every check ends up as Pass, Fixed, Info, Warning or Fail in a summary. Corrections only apply to that one deployment. The script never rewrites your parameter file; it tells you what to change in it.
The cluster side, by hand#
-ConfigureClusterNodes needs PowerShell remoting from your workstation to the nodes. When that is not available, or you simply want to watch it happen, copy the three scripts from scripts/ to one node and run them there in an elevated PowerShell session. One node is enough: the Health Service settings are cluster-wide, and the task registration copies the script to the other nodes itself.
Start by checking that the copy survived. A paste error shows up here as a parse error, before anything runs:
$scripts = 'Set-AzLocalHealthSettings', 'Watch-AzLocalVmState',
    'Register-AzLocalVmStateTask'
$scripts | ForEach-Object { Get-Command ".\$_.ps1" -Syntax }
Then the Health Service settings, first as a dry run:
.\Set-AzLocalHealthSettings.ps1 -DryRun
.\Set-AzLocalHealthSettings.ps1
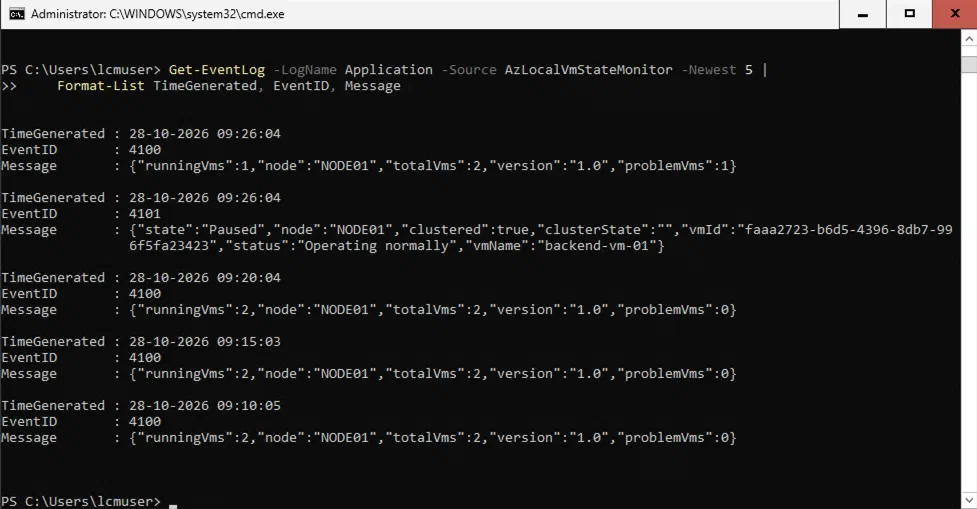
Run the VM state check once by hand before you schedule it, and look at what it wrote:
.\Watch-AzLocalVmState.ps1 -Verbose
Get-EventLog -LogName Application -Source AzLocalVmStateMonitor -Newest 5 |
    Format-List TimeGenerated, EventID, Message
Event 4100 with the VM totals means it works. If a VM is not Running or Off, the script waits a minute and then writes a 4101 for it.
Now register the task:
.\Register-AzLocalVmStateTask.ps1 -DryRun
.\Register-AzLocalVmStateTask.ps1 -ExcludedVmNames 'template-w2022,lab-vm01'
It copies Watch-AzLocalVmState.ps1 to C:\ProgramData\AzLocalMonitoring on every node through the admin share and registers a ClusterWide task that runs every five minutes. If the admin shares are not reachable, put the script in that folder on every node yourself (or on a Cluster Shared Volume and point -TargetFolder at it) and add -SkipCopy. The copies in your home folder are not used after this.
Ten minutes later, every node should have run the task without errors:
Invoke-Command -ComputerName (Get-ClusterNode).Name -ScriptBlock {
    Get-ScheduledTask -TaskName 'AzLocal-VmStateMonitor' | Get-ScheduledTaskInfo
} | Select-Object PSComputerName, LastRunTime, LastTaskResult
A LastTaskResult of 0 on every node is what you want.
The order of this and the deployment does not matter much. Events written before the deployment simply stay on the nodes, because only the supplemental DCR brings them to Log Analytics. If you deploy first, the “VM state monitor not running” alert fires until the task runs on every node, which is a decent test of the watchdog in itself.
Validate before you trust the alerts#
An alert rule that never fires looks exactly like a healthy cluster.
So after the deployment I test the chain in four steps, from the bottom up: is the collection configured, does the data arrive, can the alert rules run, and does a real problem end up in a mailbox. Give it fifteen to thirty minutes after the deployment before you start, because the first data from a new DCR association can take a while.
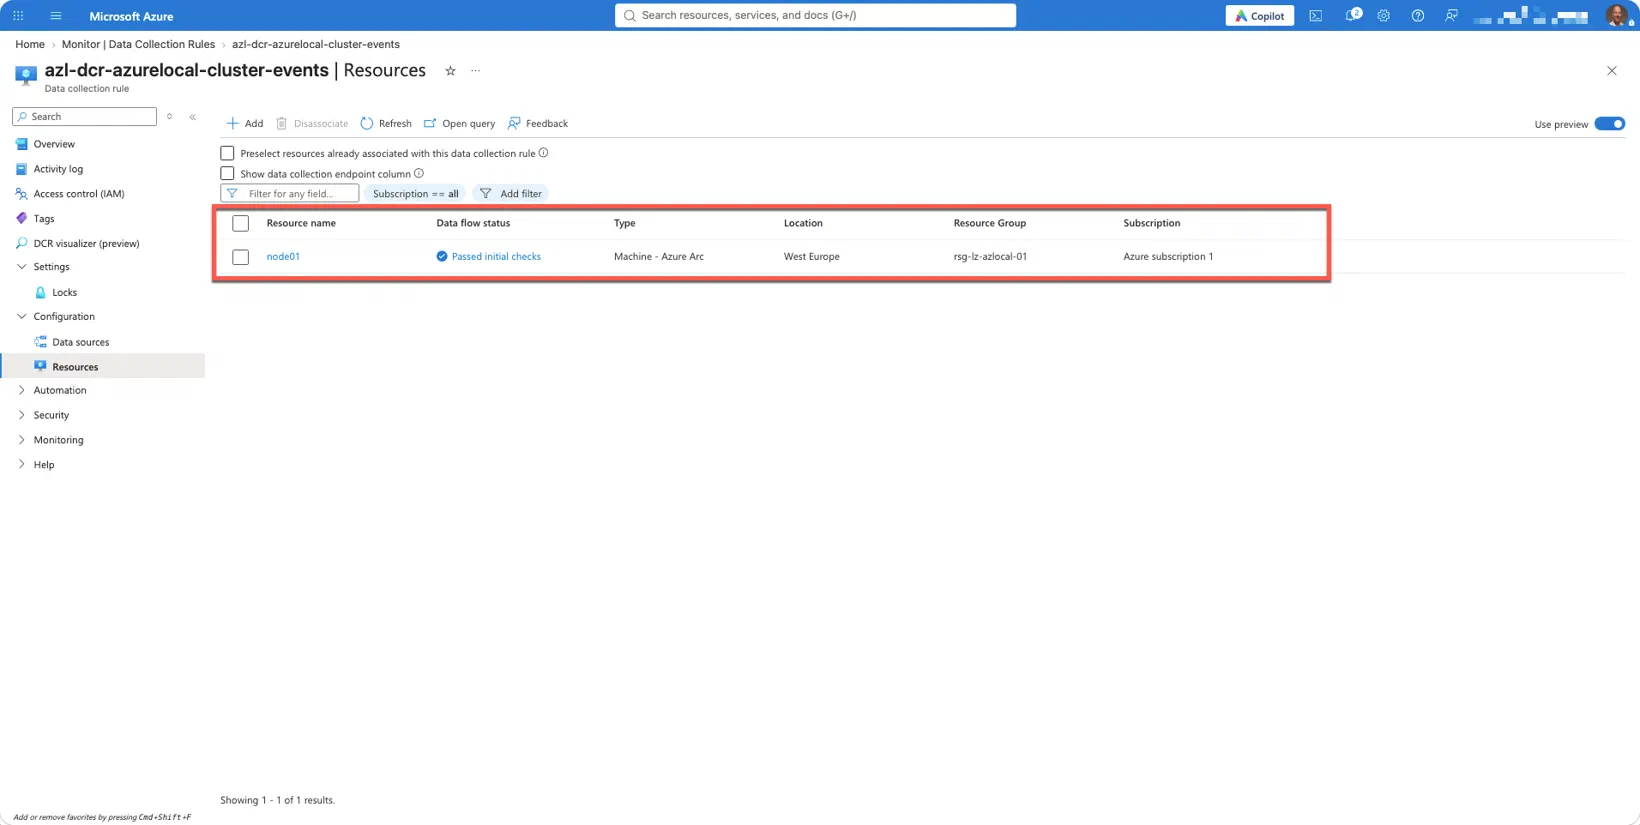
Step 1: Is the data collection rule associated?#
- Open Monitor > Data Collection Rules.
- Open
azl-dcr-azurelocal-cluster-events(the prefix follows yournamePrefix). - Under Resources, check that every node of the cluster is listed.
- Under Data sources, check the Windows event log source and its XPath queries, including the one on the Application log for the source
AzLocalVmStateMonitor.
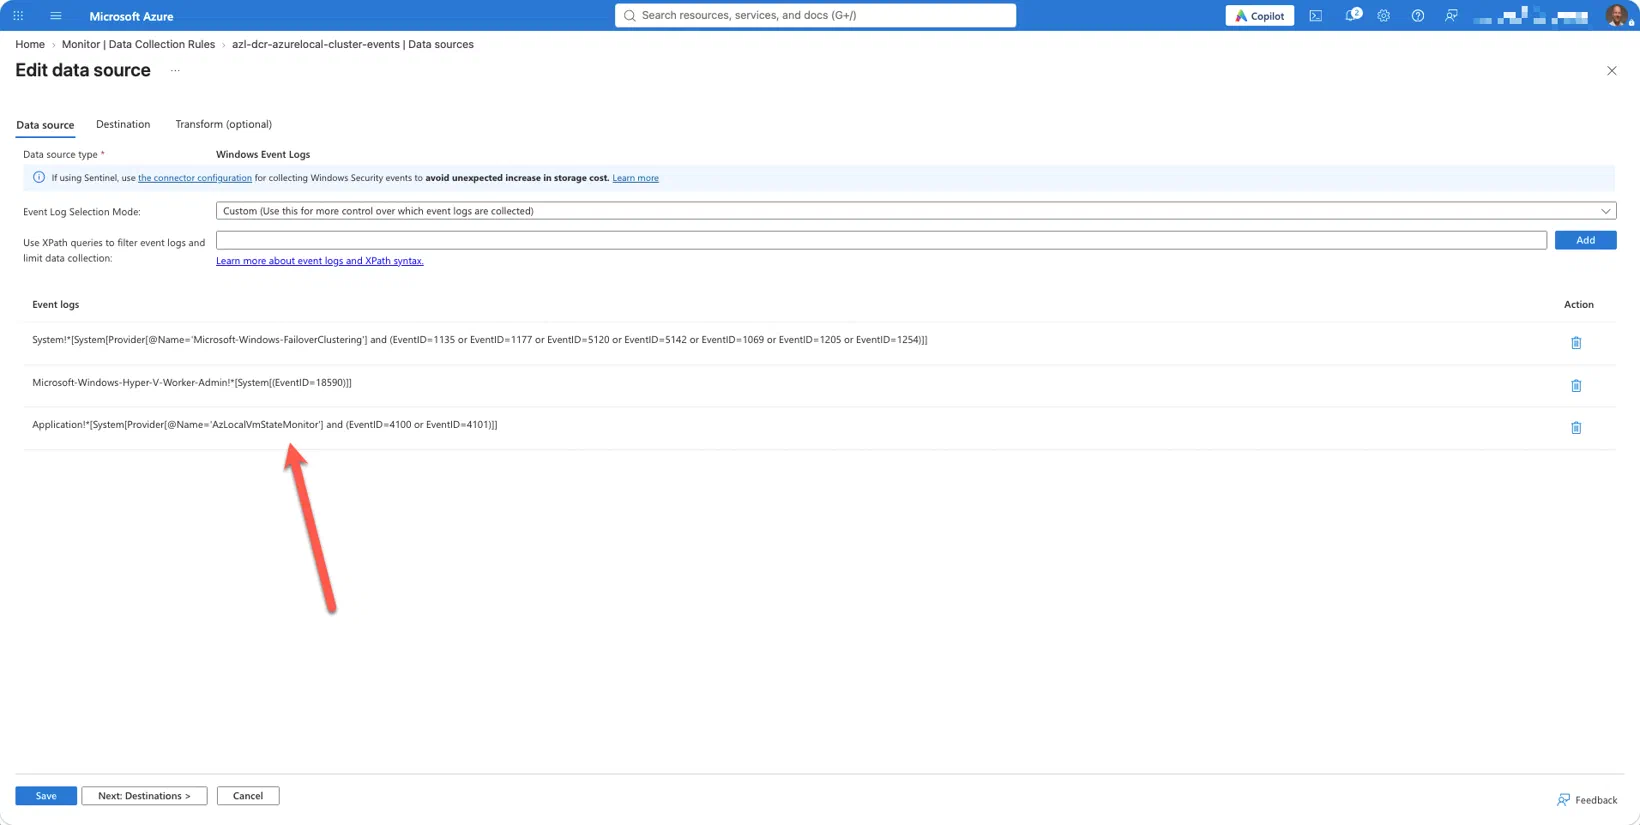
No DCR means no deployment yet. The events are written on the nodes, but nothing brings them to Log Analytics.
Step 2: Does the data arrive?#
Run the queries in the Log Analytics workspace that Insights uses: Log Analytics workspaces > your workspace > Logs, in KQL mode. Do not use the Logs blade of the cluster. The events belong to the Arc machines of the nodes, not to the cluster resource, so a query scoped to the cluster returns nothing.
Start with the VM state monitor:
Event
| where TimeGenerated > ago(1h)
| where EventLog == "Application" and Source == "AzLocalVmStateMonitor"
| summarize Runs = countif(EventID == 4100),
            Problems = countif(EventID == 4101),
            LastRun = max(TimeGenerated) by Computer
Every node should be in the result, with around twelve runs per hour and a last run from the last few minutes.
Then look at the payload itself. This is the check I would never skip, because both VM state alerts parse that JSON:
Event
| where TimeGenerated > ago(1h)
| where Source == "AzLocalVmStateMonitor"
| project TimeGenerated, Computer, EventID, RenderedDescription
| take 10
RenderedDescription should contain the JSON the script wrote, starting with something like {"node":"...","totalVms":...}. If that column is empty, the alert queries see nothing and have to read the message from EventData instead.
The node heartbeats:
Heartbeat
| where TimeGenerated > ago(15m)
| summarize LastHeartbeat = max(TimeGenerated) by Computer
And the VM counts from the SDDC Management events, which you can compare one to one with Get-VM on the nodes:
Event
| where TimeGenerated > ago(2h)
| where EventLog == "Microsoft-Windows-SDDC-Management/Operational"
| where EventID == 3000
| extend payload = parse_json(RenderedDescription)
| mv-expand server = payload.m_servers
| extend Node = tostring(server.m_name), vm = server.m_vm
| summarize arg_max(TimeGenerated, vm) by Node
| project Node, TimeGenerated,
    Running = toint(vm.m_totalVmsRunning),
    Stopped = toint(vm.m_totalVmsStopped),
    Paused = toint(vm.m_totalVmsPaused),
    Failed = toint(vm.m_totalVmsFailed)
These events usually come from a single node, the owner of the SDDC Management cluster resource, but they carry the counts for every node. With the 900-second interval a new one arrives every fifteen minutes. The Virtual machines tab under Insights on the cluster shows the same data if you want a quick visual check.
The failover clustering and Hyper-V events only show up when something happened. An empty result for those is good news.
Step 3: Can the alert rules run?#
- Open Monitor > Alerts > Alert rules and filter on the monitoring resource group.
- Check that every rule is Enabled.
- Open the managed identity
azl-id-alert-rulesand go to Azure role assignments. Log Analytics Reader on the workspace and Reader on the cluster resource group should be there. Without them none of the log search alerts can read anything, and none of them will ever fire. - In Monitor > Alerts, look for
azl-vm-state-monitor-not-running. If you deployed before the scheduled task existed, it fired. It turns Resolved within about half an hour after the task started running on every node, because a stateful log search alert that evaluates every fifteen minutes needs two clean periods before it calls the problem solved.
That last one is a free test of the watchdog.
Step 4: Break something on purpose#
The only real test is a real problem. Pause a VM you can spare, and write down the time:
Suspend-VM -Name <test-vm>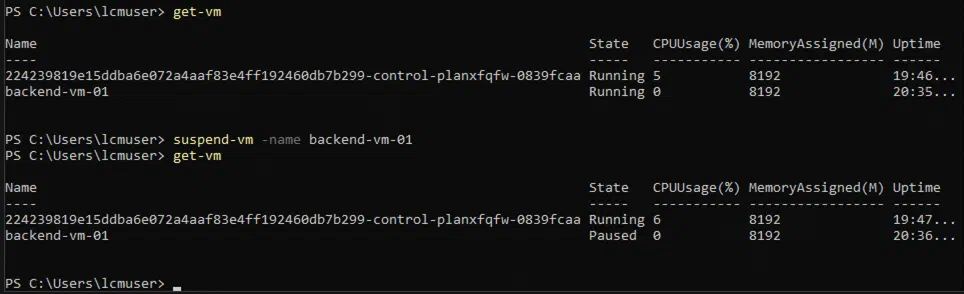
Then be patient. Every link in the chain runs on its own schedule, and the waiting adds up:
| After the pause | What happens |
|---|---|
| 0 to 5 minutes | The next run of the task finds the VM in Paused |
| plus 1 minute | The second sample confirms it and the task writes event 4101 on the node |
| plus 1 to 3 minutes | The 4101 arrives in the workspace and shows up in the first query of step 2 |
| plus 0 to 5 minutes | The next evaluation of the rule fires “Azure Local - VM not Running or Off” |
| plus 1 to 5 minutes | The action group sends the mail |
So count on roughly ten to fifteen minutes from the pause to the mail, and do not start troubleshooting after five. In my lab the 4101 was in the workspace within three minutes after the task wrote it. Microsoft notes that log ingestion can occasionally be slower, and the alert service retries an evaluation when data comes in late, so on a bad day it can take a bit longer.
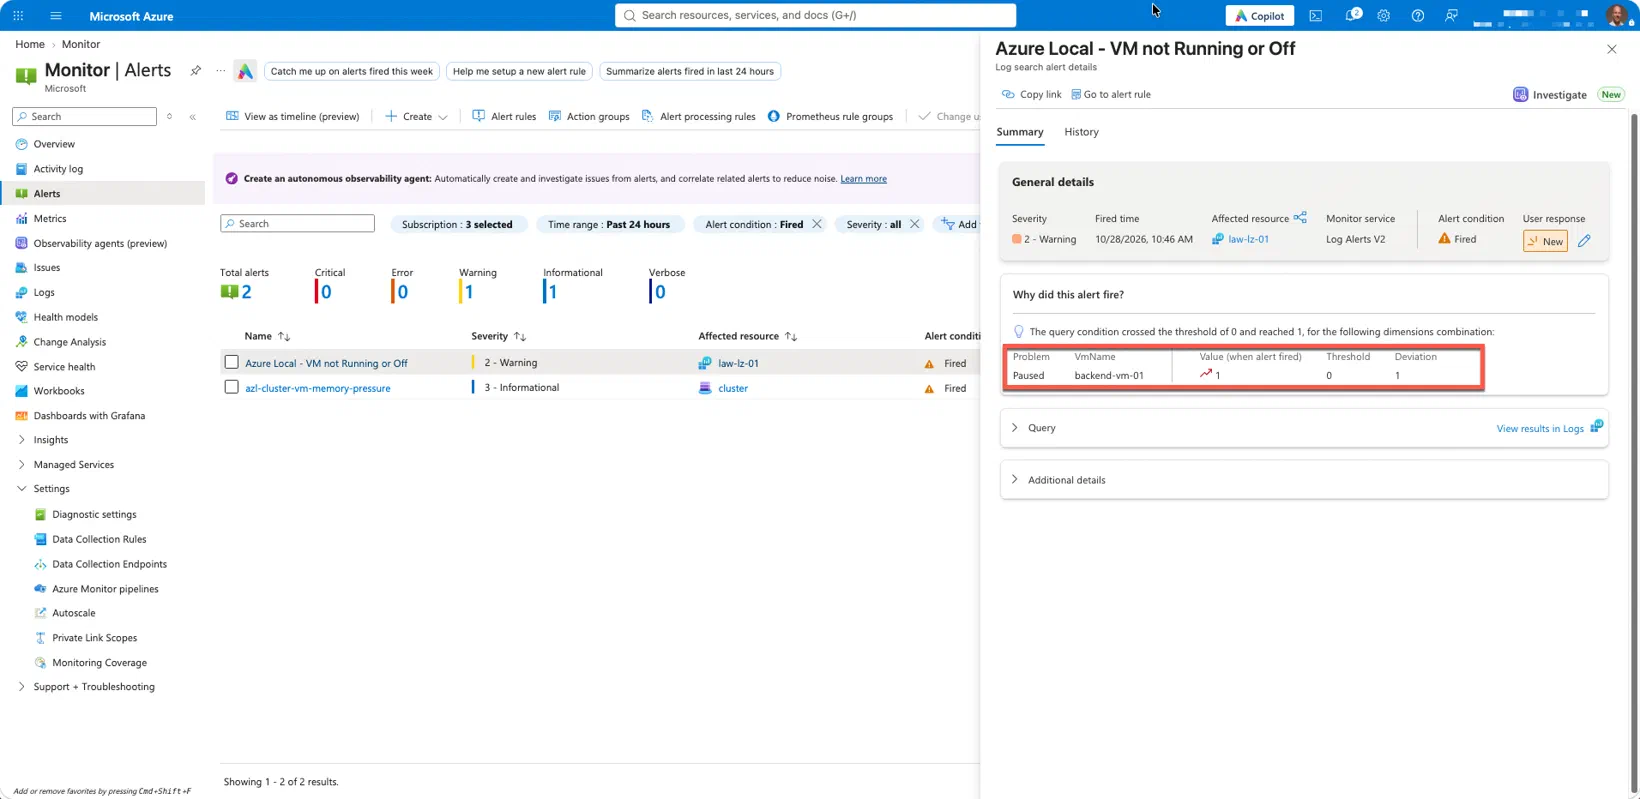
Leave the VM paused until the mail is in. While it is paused, the task writes a new 4101 every five minutes, so the condition stays true. The rule is stateful, so you get one mail and not one every five minutes. In Monitor > Alerts the alert carries the VM name and Paused as its dimensions.
Bring the VM back when you have seen it:
Resume-VM -Name <test-vm>Resolving takes longer than firing. The last 4101 stays in the fifteen-minute window of the rule, and after that a rule that evaluates every five minutes wants three clean periods before it resolves. Expect the Resolved state, and the resolved mail, about 25 to 30 minutes after Resume-VM.
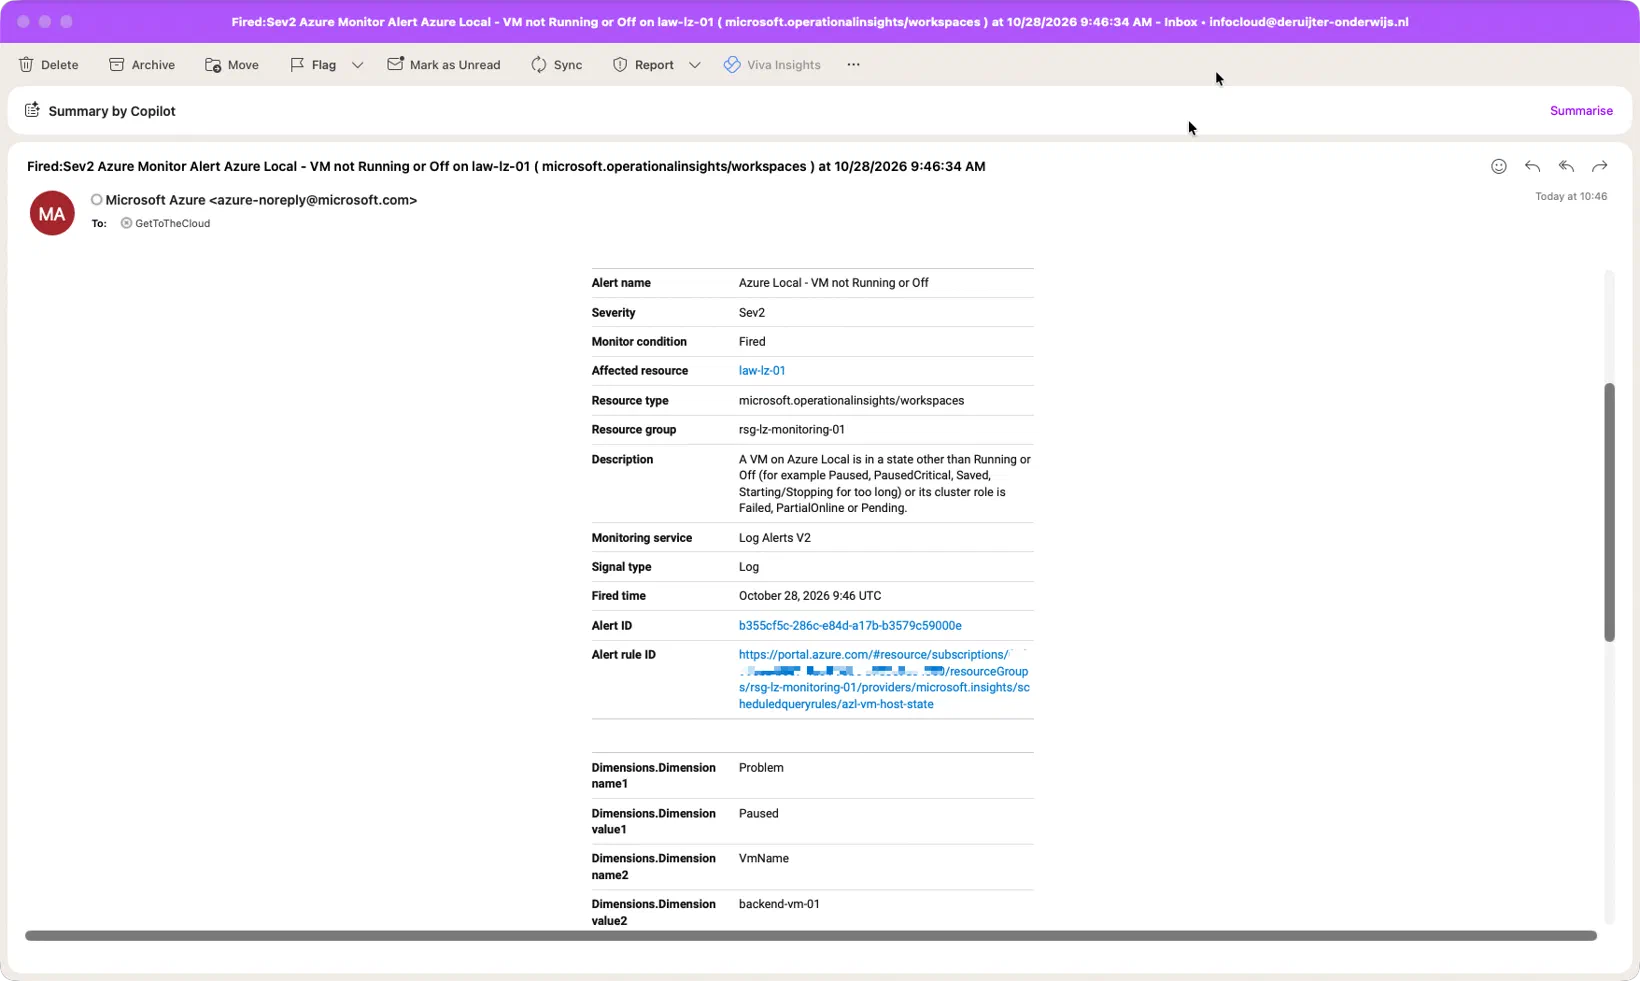
If no mail arrives within twenty minutes of the pause, walk back through step 3, 2 and 1. One of them is not doing what you think it does. After a new deployment of the rules, give it up to half an hour: in my lab the first alert after the deployment took twenty-six minutes.
The download has a script for that walk back, Test-AzLocalAlertRules.ps1. Without its canary switches it changes nothing. For one rule it shows the same things the alert service works with:
- the identity of the rule and its role on the workspace, with the age of the assignment;
- Resource health;
- the alerts the rule fired in the last 24 hours, and whether an alert processing rule suppressed the mail;
- the query of the rule over its own fifteen-minute window, tested against the threshold;
- per node, how old the last 4101 is, both on the clock of the node and on arrival in the workspace.
.\Test-AzLocalAlertRules.ps1 -ResourceGroupName rg-azlocal-monitoring -RuleName azl-vm-host-stateThis is the part of the output that mattered in my lab, once the rule ran as the identity (names shortened, IDs removed):
=== Rule azl-vm-host-state (Azure Local - VM not Running or Off) ===
  [OK  ] Enabled
  [INFO] Evaluates every PT5M over PT15M, autoMitigate True, skipQueryValidation True
  [OK  ] Runs as user-assigned identity azl-id-alert-rules
  [OK  ] Log Analytics Reader on the rule scope (law-azurelocal), assigned 40 minutes ago
  [OK  ] Alert 2026-10-28 09:46 UTC: Fired, New
  [INFO] Query over the rule window (PT15M): 1 rows. Over 24 hours: 1 rows.
  [INFO]   VmName=test-vm01, Problem=Paused: 1 -> meets the condition
  [OK  ] The data meets the condition and the rule has fired
When the data meets the condition and the rule still fires nothing, -CreateCanaryRule adds a test rule that cannot miss. It counts rows in the Heartbeat table and uses the same workspace, identity and action group. When the canary mails you, the alert service, the identity and the action group work, and the problem is in the rule or its data. Remove the canary with -RemoveCanaryRule.
One thing not to rely on: Resource health of the rule. Mine still said Unknown while the rule had already fired.
Once the chain works, you do not have to repeat step 2 by hand. Every rerun of Deploy-AzLocalMonitoring.ps1 -WhatIf checks the heartbeats, the SDDC events and the VM state monitor for you. Steps 1, 3 and 4 are worth repeating after every change to the template or the cluster, such as a node that was added.
What this does not try to do#
It does not enable Insights for you, for the reason above. It does not build dashboards, because the Insights workbooks and the performance metrics workbooks already cover that. The thresholds are starting points based on how clusters fail, not a recommendation for your workload. And it assumes one Log Analytics workspace per deployment. If your clusters send Insights to different workspaces, run it once per workspace.
Test it against your own Azure Local release and hardware before you rely on it in production, and start with -WhatIf.
Get notified and wake up!#
Azure Local has the signals. What is missing is the decision about which signal should wake somebody up.
Do you know which alert would reach you if a drive failed tonight? Can your cluster lose a node during patch night without overcommitting memory? Would you notice a VM that has been paused since this afternoon?
If the answer to any of those is “not sure”, take the template, run it with -WhatIf against your own environment and read the summary. Change the thresholds, add the event IDs you care about, and if you improve something, open a pull request.
Download contents#
Everything is in the GitHub repository GetToThe-Cloud/azure-local-extended-monitoring:
Deploy-AzLocalMonitoring.ps1: checks and fixes the prerequisites, then the what-if and the deploymentTest-AzLocalAlertRules.ps1: shows why a log search alert does or does not firemain.bicepandmain.bicepparam: the template and an example parameter filemodules/: action group, alert identity, routing, metric alerts, event collection, log search alerts, Resource Health and the VM state alertsqueries/: the KQL behind every log search alertscripts/:Set-AzLocalHealthSettings.ps1,Watch-AzLocalVmState.ps1andRegister-AzLocalVmStateTask.ps1for the cluster side