
Getting Azure Local deployed is only the beginning.
The real work starts after the installation team has left, the workloads are running, and the platform becomes part of normal operations. That is where Day 2 Operations begins. It is the point where you need to understand whether the platform is healthy, whether capacity is still sufficient, and whether workload placement is becoming unbalanced.
I wanted a single view that answers those questions without jumping between different blades, log queries, and spreadsheets. So I created an Azure Monitor Workbook that brings the most important Azure Local operational signals together.
The complete package is available with this post. It contains the workbook JSON, a supplemental Data Collection Rule, a PowerShell deployment helper, validation queries, and installation instructions.
What should we monitor after deployment?
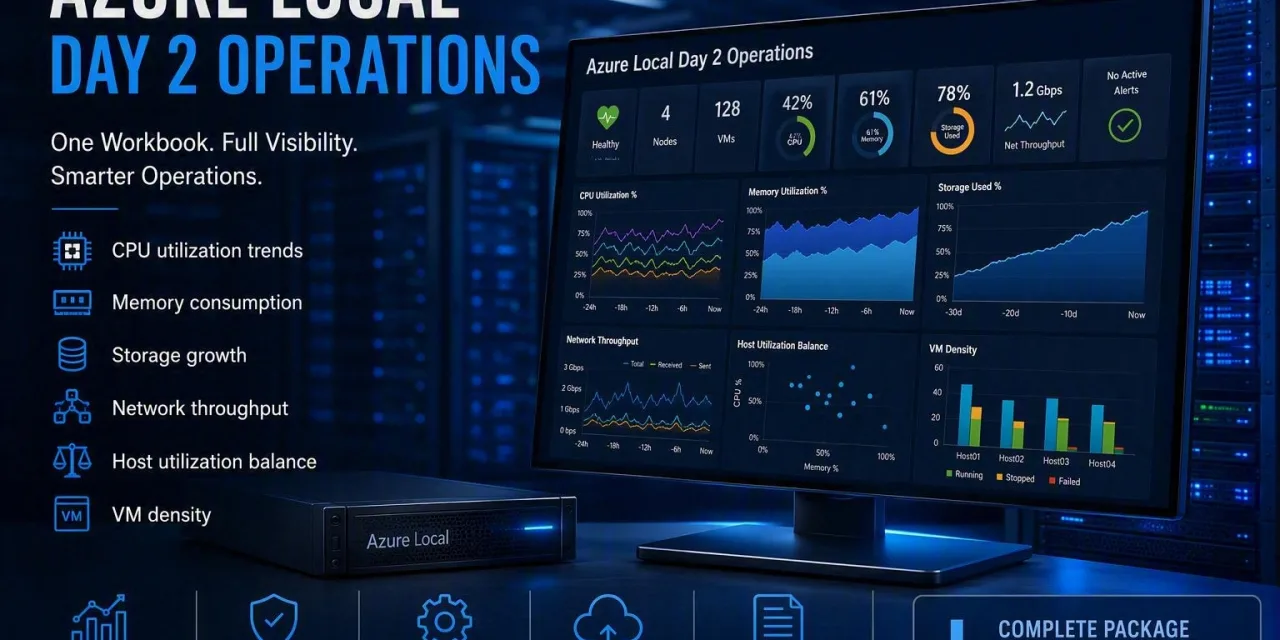
For me, Azure Local Day 2 Operations starts with six continuous monitoring areas:
- CPU utilization trends
- Memory consumption
- Storage growth
- Network throughput
- Host utilization balance
- VM density
These metrics are related. High CPU utilization on one host may not be a cluster capacity problem. It may be a placement or balance problem. Increasing storage consumption may be expected, but the growth rate tells you when the next expansion decision needs to be made. VM density may look acceptable until you consider the capacity that must remain available when a host is unavailable.
Looking at each counter in isolation is not enough. The goal is to create operational context.
Why use Azure Monitor Workbooks?
Azure Local monitoring is integrated with Azure Monitor. Insights collects health and performance information, stores logs in Log Analytics, and uses KQL and workbooks to visualize the results. Microsoft also makes the built-in Insights experience customizable, which means an existing workbook can be used as a starting point for a platform-specific operations view.
A workbook is a good fit because it can combine queries, parameters, charts, tables, and operational guidance in one interface. It can also be shared with the team and deployed as code.
That last point is important. An operations dashboard should not become a manually maintained portal artifact that nobody can reproduce.
The workbook structure
The workbook in the download contains eight tabs.
Overview
The first tab provides a quick cluster summary. It shows the number of nodes, the total number of virtual machines, average CPU utilization, average memory utilization, and the latest host health and utilization state.
This is not intended to replace detailed troubleshooting. It is the view you open first to decide where to investigate.
CPU
The CPU tab shows utilization over time for each host. It also calculates average, peak, and P95 utilization.
Peak utilization alone can be misleading. A short spike may be perfectly normal. P95 and historical trends make it easier to distinguish a temporary burst from sustained pressure.
Questions this tab should help answer include:
- Is CPU demand increasing over time?
- Is one node consistently busier than the others?
- Are high peaks isolated or recurring?
- Is observed CPU demand leaving enough headroom for maintenance or a host failure?
Memory
Memory is often the first resource that limits virtualization density. The workbook calculates memory utilization from the Azure Local SDDC management snapshots and shows both the current state and historical trend.
This makes it easier to identify nodes that are structurally under pressure. It also shows whether the problem is local to one host or visible across the cluster.
The workbook collects additional memory counters through the DCR, but its main memory visualization uses the Azure Local management event data. This keeps the host balance calculation aligned with the same node snapshots used for VM density.
Storage
Storage needs more than a percentage gauge. The important question is not only how much capacity is currently used, but how quickly it is growing.
The storage tab shows used, free, and total capacity over time. It also provides a per-volume view with utilization, IOPS, throughput, and latency in milliseconds when those values are available in the SDDC management events.
This tab is intended to support capacity planning. It gives you the raw trend required to discuss when expansion is needed, rather than waiting for a threshold alert to fire.
Network
The network tab queries the Perf table for network interface and network adapter throughput. RDMA activity is shown separately.
Separating the two matters because not every environment exposes the same counters. Hardware, drivers, operating system language, and the actual network design can affect counter availability. An empty RDMA chart does not automatically mean that the workbook is broken.
The data quality tab helps verify whether the required counters are arriving in Log Analytics.
Host balance
This is one of the most useful parts of the workbook.
A cluster can have sufficient total capacity while still being badly balanced. One node may run hot while another remains lightly loaded. That can affect performance and reduce operational headroom.
The workbook compares each host with the current cluster average for CPU, memory, and VM count. It also calculates a custom balance score based on the spread between hosts.
The score is an operational indicator. It is not a Microsoft support threshold and it should not trigger automatic VM moves without context. Affinity rules, maintenance, failure domains, workload criticality, and reserve capacity still matter.
Use the score to start a conversation and investigation, not to replace engineering judgement.
VM density
The VM density tab shows running, stopped, failed, and other VM states per host, together with the number of logical processors and the calculated VM density.
VM density must always be interpreted together with workload size and availability requirements. Twenty small management VMs are not the same as twenty memory-heavy database servers.
The most important operational question is whether the remaining hosts can absorb the workloads after a node becomes unavailable. This workbook does not perform a failover-capacity simulation; a density number without failure capacity is only half the story.
Data quality
Every monitoring solution needs to monitor its own input.
The data quality tab shows the newest records in Perf, Azure Local SDDC events, health events, and Heartbeat for the selected cluster. If a chart is empty, this is the first place to look.
A beautiful workbook with stale telemetry is worse than no workbook because it creates false confidence.
The Data Collection Rule
The package contains an ARM template for a supplemental DCR. It deliberately avoids the event logs and baseline counters already collected by the Microsoft-managed Insights DCR. It adds:
- Memory
% Committed Bytes In Use - Network Interface
Bytes Received/secandBytes Sent/sec - Network Adapter
Bytes Total/sec,Bytes Received/sec, andBytes Sent/sec
The Microsoft-managed Insights DCR remains responsible for Azure Local SDDC management events 3000, 3002, and 3003, Azure Local health events, Processor counters, Memory Available Bytes, Network Interface Bytes Total/sec, and RDMA activity counters. Windows events are written to the Event table and performance counters are written to the Perf table in the selected Log Analytics workspace.
Microsoft recommends enabling Azure Local Insights and retaining the DCR created by Insights because that DCR contains a special data stream required by the Insights experience. Do not configure the same event log or performance counter in both DCRs: overlapping sources can create duplicate records and additional ingestion charges. Check the existing Insights DCR before associating this supplemental rule.
Sources:
- Collect Windows events with Azure Monitor Agent
- Collect performance counters with Azure Monitor Agent
- Data Collection Rules in Azure Monitor
That distinction is deliberate. It keeps the Microsoft-managed monitoring experience intact without collecting the same telemetry twice.
Deploying the DCR
Start by enabling Azure Local Insights on the cluster. Confirm that the Azure Monitor Agent is healthy and that data reaches the Log Analytics workspace. Install the Az.Accounts and Az.Resources PowerShell modules, for example with Install-Module -Name Az.Accounts, Az.Resources -Scope CurrentUser, and make sure the subscription you pass to the helper is the intended one.
Deploy the supplemental DCR with the included PowerShell helper:
Connect-AzAccount

./Deploy-DCR.ps1 `
  -ResourceGroupName "rg-monitoring-prod" `
  -SubscriptionId "<subscription-id>" `
  -WorkspaceResourceId "/subscriptions/<subscription-id>/resourceGroups/<resource-group>/providers/Microsoft.OperationalInsights/workspaces/<workspace-name>" `
-Location "westeurope"The helper deploys the supplemental DCR only. It verifies the requested subscription and creates the resource group if it does not exist; it does not create node associations.
After deployment, associate the supplemental DCR with every Arc-enabled Azure Local server node, while leaving the Microsoft-managed Insights DCR associated:
- Open Azure Monitor.
- Open Data Collection Rules.
- Select the new Day 2 Operations DCR.
- Open Resources.
- Add every Azure Local Arc-enabled server node.
- Save the association.
Use the same Log Analytics workspace that you select in the workbook.
Importing the workbook
The workbook file is a gallery template and can be imported directly:
- Open Azure Monitor.
- Open Workbooks.
- Create a new workbook.
- Select Edit.
- Open Advanced Editor using the
</>button. - Select Gallery Template.
- Replace the existing JSON with the supplied workbook JSON.
- Select Apply.
- Save the workbook.
- Select the Azure Local cluster and Log Analytics workspace parameters.
The workbook offers time ranges for operational and capacity analysis. Longer ranges are useful for growth trends, but they also depend on the configured Log Analytics retention period.
Validate before you trust the charts
Run the following query to confirm that the required Azure Local events are arriving:
Event
| where EventLog =~ "Microsoft-Windows-SDDC-Management/Operational"
| where EventID in (3000, 3002, 3003)
| summarize Records=count(), LastRecord=max(TimeGenerated) by EventIDValidate performance counter collection with:
Perf
| where ObjectName in~ ("Processor", "Memory", "Network Interface", "Network Adapter", "RDMA Activity")
| summarize Records=count(), LastRecord=max(TimeGenerated) by ObjectName, CounterName
| order by ObjectName asc, CounterName ascFinally, check heartbeat freshness:
Heartbeat
| summarize LastHeartbeat=max(TimeGenerated) by Computer
| extend MinutesOld=datetime_diff("minute", now(), LastHeartbeat)
| order by MinutesOld descDo not skip this step. First prove that the telemetry exists. Then validate the workbook.
Sampling, retention, and cost
The supplied DCR uses a 60-second sampling interval for performance counters. That is a reasonable starting point for many environments, but it is not a universal recommendation.
A lower interval produces more detail and more ingestion. A longer interval reduces ingestion but can hide brief peaks. The right choice depends on the workloads, troubleshooting requirements, retention period, and budget.
Azure Monitor platform metrics for Azure Local provide near real-time monitoring and are available out of the box, while logs in Log Analytics provide flexible KQL analysis and longer operational context. In practice, I use both. Metrics are well suited for near real-time charts and alerts. Logs and workbooks are better suited for correlation, historical analysis, and a shared operations view.
Review ingestion after the first week. Remove counters nobody uses, tune the sampling interval, and set retention deliberately. Collecting everything forever is not a monitoring strategy.
What this package does not try to do
This package is a starting point for platform operations. It does not automatically solve capacity management, workload placement, or alert ownership.
It also does not include fixed production thresholds. A CPU threshold that makes sense for one cluster may be too aggressive or too relaxed for another. Establish a baseline during normal operation, maintenance, backup windows, and peak workload periods. Then define thresholds based on observed behavior and required headroom.
The same applies to the balance score. Treat it as a signal that supports investigation.
I think
Day 2 Operations is not about collecting as many counters as possible. It is about turning telemetry into decisions.
Can we perform maintenance without creating capacity pressure? Is storage growing faster than expected? Are workloads distributed sensibly? Is one host carrying more risk than the others? Is the monitoring data itself still current?
A single workbook will not answer every question, but it creates one shared starting point for operators, architects, and service owners.
Download the package, deploy it in a test environment, and adjust it to your operational baseline. If you improve the queries or add useful Day 2 views, I would love to hear what you changed.
Download contents
The downloadable package contains:
- The complete Azure Monitor Workbook JSON
- A supplemental Azure Monitor DCR ARM template
- A PowerShell deployment helper
- A README with installation and validation steps
https://github.com/GetToThe-Cloud/Website/tree/main/AzureLocal-Day2%20Operations
Test everything against your own Azure Local release and hardware before using it in production.