
In June 2024 I wrote about monitoring Azure Virtual Desktop session hosts. The Log Analytics Agent was about to be retired, and the goal of that post was simple: get the Azure Monitor Agent on every session host, attach a Data Collection Rule and let Azure Policy keep it that way. That goal was reached in most environments I work in. The agent is there, the data is flowing, and the workspace is filling up nicely.
And then nobody looks at it.
That is the real problem with monitoring. Collecting telemetry is the easy part. Turning it into something a service desk engineer can open at 08:15 on a Monday, when the first users start complaining that “AVD is slow”, is where most environments stop. So this post is the logical follow-up to both the 2024 post and my recent Azure Local | Day 2 Operations post. Same approach, different workload: a free Azure Monitor workbook for AVD session hosts, a supplemental Data Collection Rule, the KQL behind every chart, and the queries to validate it before you trust it.
What changed since 2024?
Quite a lot, actually. The Log Analytics Agent was retired on 31 August 2024, so the Azure Monitor Agent is no longer a choice but the only option. Azure Virtual Desktop Insights moved along with it. It now relies on a Data Collection Rule that must be named with the microsoft-avdi- prefix (for example microsoft-avdi-westeurope), because the Insights workbook looks for that name. Round trip time in Insights is no longer calculated from the RemoteFX performance counter but from the AVD network logs in WVDConnectionNetworkData, and unhealthy hosts are highlighted much more prominently than before.
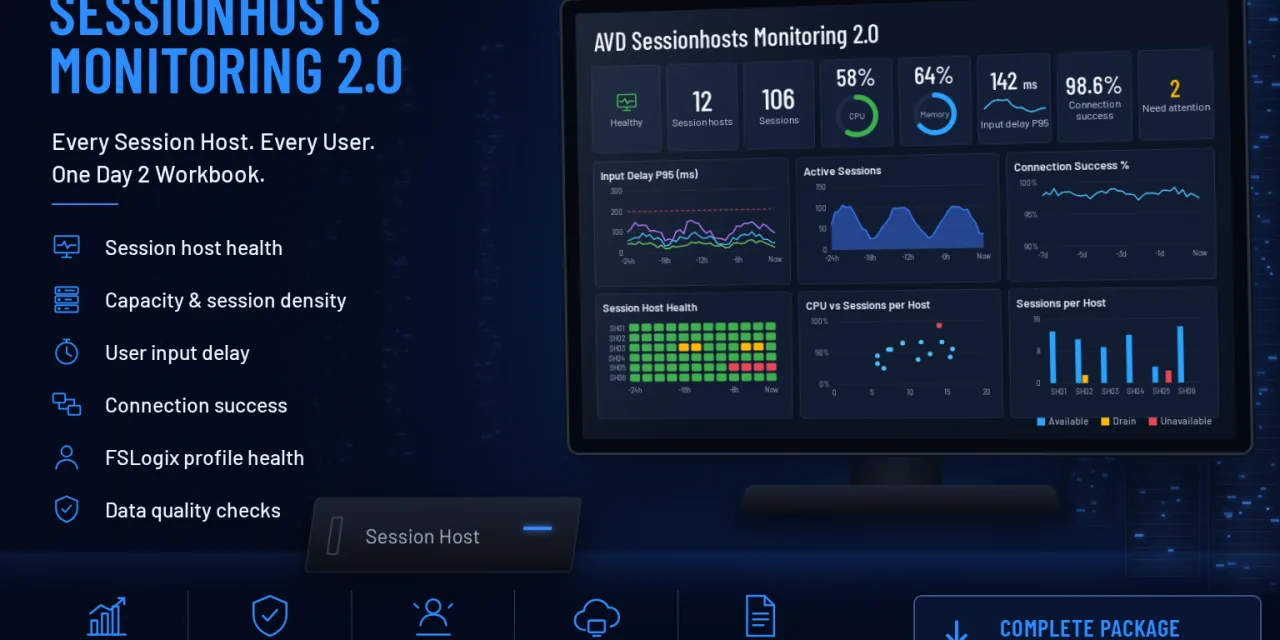
All good changes. But AVD Insights is built to answer the question “what is happening in this host pool?”. In daily operations I usually need a slightly different answer: “which session host should I look at first, and why?”. That is what version 2.0 is about.
What should we monitor on a session host?
A session host is not a normal server. A file server with 90% CPU is busy. A session host with 90% CPU is a room full of people who can no longer type. That changes what you measure. Next to the classic CPU, memory and disk counters, a session host needs to be judged on the experience of the users sitting on it.
In practice I look at six things. The health of the AVD agent and its health checks, because a host that reports NeedsAssistance will not receive new sessions. Capacity and density, meaning how many sessions a host carries and what each session costs in CPU and memory. User experience, measured as input delay and round trip time. Connection success, because a failed connection is the first thing a user notices. FSLogix, because a profile that does not attach turns a login into a ticket. And finally data quality, because a chart that is quiet because nothing is wrong looks exactly the same as a chart that is quiet because nothing is being collected.
Why use an Azure Monitor Workbook again?
For the same reasons as in the Day 2 post. A workbook lives next to the data in Azure Monitor, uses the RBAC you already have, needs no extra infrastructure and is just JSON. That means you can put it in Git, review changes, and deploy the exact same view to every customer or landing zone. It also sits nicely next to AVD Insights instead of replacing it. Insights remains the place for deep dives per user or per connection, while the Day 2 workbook is the place you start.
The architecture
The design principle is the same as for Azure Local: do not touch what Microsoft manages. The microsoft-avdi-<region> Data Collection Rule stays exactly as the Insights configuration workbook created it. Everything extra goes into a separate, supplemental rule called dcr-avd-day2-<region>. Both rules are associated with the session hosts through Azure Policy, and the host pool diagnostic settings send the WVD* tables to the same Log Analytics workspace.
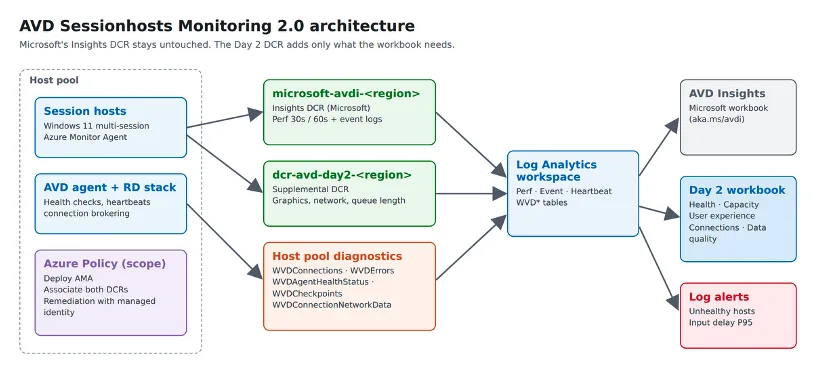
Keeping the rules apart has a practical advantage. When Microsoft updates the counters Insights needs, you rerun the Insights configuration workbook and nothing of your own is overwritten. When you want to change the Day 2 counters, you redeploy one small ARM template and Insights keeps working.
The workbook structure
The workbook has seven tabs, all driven by three parameters at the top: the Log Analytics workspace, one or more host pools and the time range. The host pool parameter is resolved through Azure Resource Graph, so the list of session hosts per host pool is always current, including hosts that have not sent any data yet. That last part matters, because a host that never shows up in Log Analytics is exactly the host you want to find.
Overview
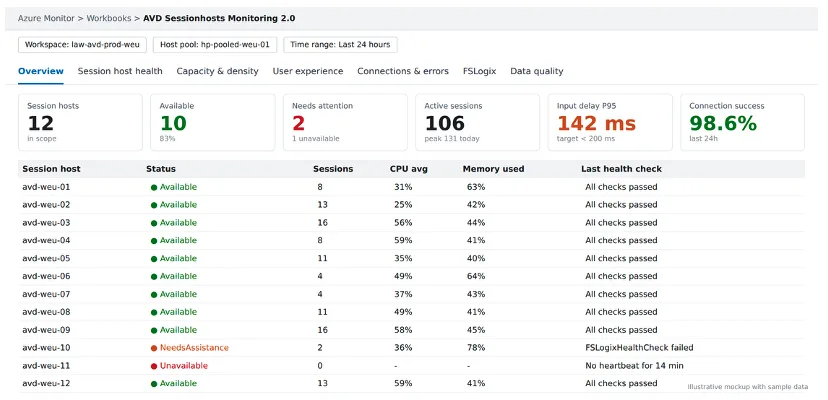
The Overview tab is the Monday morning view. The tiles show how many session hosts are in scope, how many are available, how many need attention, the number of active sessions, the P95 input delay and the connection success rate. Below that is one row per session host with its status, current sessions, average CPU, memory in use and the result of the last health check. The table is sorted by severity, so the hosts you need are always on top.
Session host health
This tab is built on WVDAgentHealthStatus. The AVD agent reports its status and the result of each individual health check, such as the domain join check, the FSLogix check and the SxS stack listener check. The heatmap shows the status per host per hour, so you immediately see the difference between a host that failed once and a host that has been flapping all afternoon.
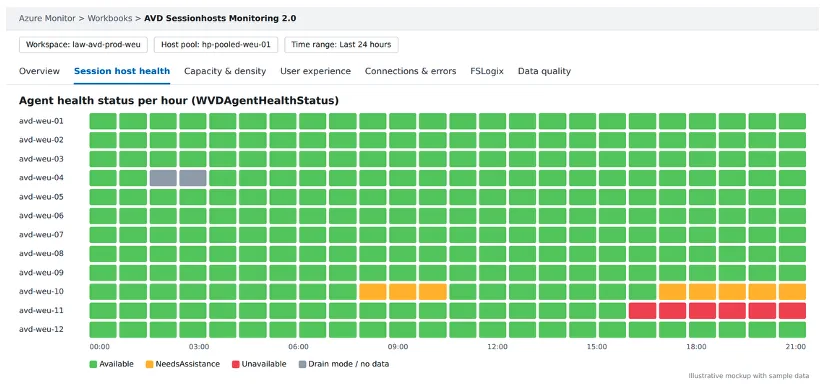
The query that finds the failing health checks unpacks the JSON array in SessionHostHealthCheckResult:
WVDAgentHealthStatus
| where TimeGenerated > ago(24h)
| where Status != "Available"
| mv-expand Check = parse_json(SessionHostHealthCheckResult)
| extend HealthCheck = tostring(Check.HealthCheckName),
         Result      = tostring(Check.HealthCheckResult)
| where Result != "HealthCheckSucceeded"
| summarize Failures = count(), LastSeen = max(TimeGenerated)
    by SessionHostName, HealthCheck, Result
| order by LastSeen desc
One thing to watch out for: the SessionHostName column in the WVD tables and the Computer column in Perf and Heartbeat do not always use the same format. Depending on how your hosts are joined you get a short name or an FQDN. The workbook normalises both to a lowercase short name with tolower(tostring(split(Computer, “.”)[0])) before joining anything.
Capacity and density
Every AVD sizing discussion eventually ends with the question “how many users can we put on one host?”. The answer is in your own data. This tab combines the Terminal Services session counters from the Insights DCR with CPU and memory, and calculates what a single session costs on each host.
let cpu = Perf
| where ObjectName == "Processor Information"
    and CounterName == "% Processor Time" and InstanceName == "_Total"
| summarize CpuP95 = percentile(CounterValue, 95) by Computer, bin(TimeGenerated, 1h);
let sessions = Perf
| where ObjectName == "Terminal Services" and CounterName == "Active Sessions"
| summarize Sessions = max(CounterValue) by Computer, bin(TimeGenerated, 1h);
cpu
| join kind=inner sessions on Computer, TimeGenerated
| where Sessions > 0
| extend CpuPerSession = CpuP95 / Sessions
| summarize AvgCpuPerSession = round(avg(CpuPerSession), 1),
            PeakSessions     = max(Sessions),
            PeakCpuP95       = round(max(CpuP95), 1)
    by Computer
| order by AvgCpuPerSession desc
If one host consistently shows a much higher cost per session than its neighbours with the same image and SKU, you are usually looking at a runaway process, a stuck update or a user with a very creative workload. If all hosts show the same high cost, your max session limit is simply too high.
User experience
This is the tab I missed most in 2024. Users do not complain about CPU, they complain about lag. The User Input Delay per Session counter measures exactly that: the time between a keystroke or mouse click and the moment the session actually processes it. Combined with the round trip time from WVDConnectionNetworkData, you can finally tell the difference between “the host is overloaded” and “the user is on hotel Wi-Fi”.
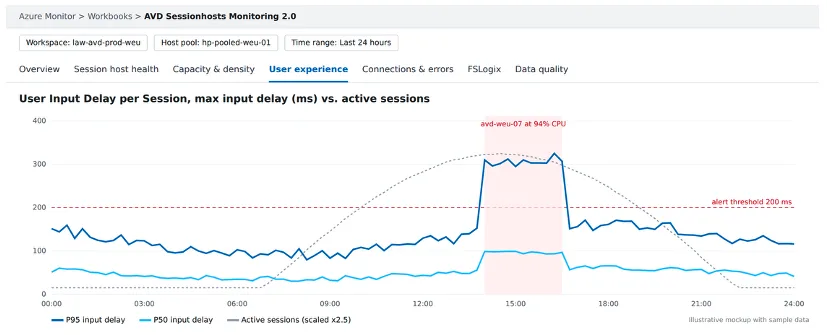
Input delay goes up when the sessions go up. The red band shows the moment one host ran out of CPU.
Perf
| where ObjectName == "User Input Delay per Session"
    and CounterName == "Max Input Delay"
| where InstanceName !in ("Max", "Average")
| summarize P50 = percentile(CounterValue, 50),
            P95 = percentile(CounterValue, 95)
    by Computer, bin(TimeGenerated, 15m)
| render timechart
Note the filter on InstanceName. The counter also publishes aggregated instances next to the per session instances, and mixing those in will quietly skew your percentiles. For the network side, the workbook joins the network data to the connection records so every measurement is linked to a session host:
WVDConnectionNetworkData
| where TimeGenerated > ago(24h)
| join kind=inner (
    WVDConnections
    | where State == "Connected"
    | project CorrelationId, SessionHostName, TransportType
  ) on CorrelationId
| summarize RttP50 = percentile(EstRoundTripTimeInMs, 50),
            RttP95 = percentile(EstRoundTripTimeInMs, 95),
            BandwidthP50 = percentile(EstAvailableBandwidthKBps, 50)
by SessionHostName, TransportTypeWhen the input delay is high and the round trip time is fine, look at the host. When the input delay is fine and the round trip time is high, look at the network or the client. When both are high, start with the host anyway, because an overloaded host also slows down its own network stack.
Connections and errors
Every connection attempt in WVDConnections gets a CorrelationId and moves through the states Started, Connected and Completed. An attempt that never reaches Connected has failed. Counting those per host gives you a connection success rate, and WVDErrors tells you why.
WVDConnections
| where TimeGenerated > ago(24h)
| summarize States = make_set(State), SessionHostName = take_any(SessionHostName)
    by CorrelationId
| extend Succeeded = set_has_element(States, "Connected")
| summarize Attempts = count(), Failed = countif(not(Succeeded))
    by SessionHostName
| extend SuccessRate = round(100.0 * (Attempts - Failed) / Attempts, 1)
| order by SuccessRate ascFailed attempts without a session host name are not a bug in the query. They failed before the broker selected a host, which usually points to authentication, Conditional Access or a host pool without available capacity. The workbook shows those as a separate row, because they need a different troubleshooting path.
FSLogix
The Insights DCR already collects the Microsoft-FSLogix-Apps/Operational and Microsoft-FSLogix-Apps/Admin logs at warning level and higher. This tab simply makes them visible per host and per event, so a storage account that is throttling or a profile container that is locked by another session shows up before the second user calls.
Event
| where TimeGenerated > ago(24h)
| where EventLog startswith "Microsoft-FSLogix-Apps"
| where EventLevelName in ("Error", "Warning")
| summarize Events = count(), LastSeen = max(TimeGenerated),
            Example = take_any(RenderedDescription)
    by Computer, EventLog, EventID
| order by Events descData quality
The last tab is the one nobody asks for and everybody needs. It shows the last heartbeat per session host, the freshness of every counter the workbook depends on and the session hosts that exist in Azure Resource Graph but have not sent a single record to the workspace. That last list is usually where you find the host that was redeployed from an image and never got its DCR association back.
The Data Collection Rule
The supplemental DCR is deliberately small. It does not repeat anything the Insights DCR already collects, because duplicate counters mean duplicate ingestion and a duplicate bill. It adds graphics counters to see whether frames are dropped because of the server, the network or the client, network throughput, processor queue length and committed memory, plus the User Profile Service log for profile issues that happen outside FSLogix.
resource dataCollectionRule 'Microsoft.Insights/dataCollectionRules@2022-06-01' = {
  name: dcrName
  location: location
  kind: 'Windows'
  properties: {
    dataSources: {
      performanceCounters: [
        {
          name: 'avdDay2Perf'
          streams: [ 'Microsoft-Perf' ]
          samplingFrequencyInSeconds: samplingFrequencyInSeconds
          counterSpecifiers: [
            '\\RemoteFX Graphics(*)\\Frames Skipped/Second - Insufficient Server Resources'
            '\\RemoteFX Graphics(*)\\Frames Skipped/Second - Insufficient Network Resources'
            '\\RemoteFX Graphics(*)\\Frames Skipped/Second - Insufficient Client Resources'
            '\\RemoteFX Graphics(*)\\Output Frames/Second'
            '\\Network Interface(*)\\Bytes Total/sec'
            '\\System\\Processor Queue Length'
            '\\Memory\\Committed Bytes'
          ]
        }
      ]
      windowsEventLogs: [
        {
          name: 'avdDay2Events'
          streams: [ 'Microsoft-Event' ]
          xPathQueries: [
            'Microsoft-Windows-User Profile Service/Operational!*[System[(Level=1 or Level=2 or Level=3)]]'
          ]
        }
      ]
    }
    destinations: {
      logAnalytics: [
        {
          name: 'logAnalyticsWorkspace'
          workspaceResourceId: workspaceResourceId
        }
      ]
    }
    dataFlows: [
      {
        streams: [ 'Microsoft-Perf', 'Microsoft-Event' ]
        destinations: [ 'logAnalyticsWorkspace' ]
      }
    ]
  }
}
The sampling interval is 60 seconds on purpose. These counters are used for trends and for explaining a problem, not for detecting it. The Insights DCR already samples the user experience counters every 30 seconds, and that is more than enough to catch a spike.
Deploying the DCR
The package contains an ARM template for the DCR and a PowerShell helper that deploys it and associates it with every session host in one or more resource groups.
az deployment sub create \
  --name avd-day2-monitoring \
  --location westeurope \
  --template-file bicep/main.bicep \
  --parameters bicep/main.bicepparam
Under the hood it does nothing magical. It deploys the template and creates the associations with the Az.Monitor module:
./Deploy-AvdDay2Monitoring.ps1 `
    -SubscriptionId "<subscription-id>" `
    -MonitoringResourceGroupName "rg-avd-monitoring" `
    -SessionHostResourceGroupName "rg-avd-sessionhosts" `
    -Location "westeurope" `
    -WorkspaceResourceId "/subscriptions/<subscription-id>/resourceGroups/rg-avd-monitoring/providers/Microsoft.OperationalInsights/workspaces/law-avd-prod-weu" `
-ImportWorkbookFor production I still prefer Azure Policy over a script, exactly as in the 2024 post. Assign the built-in policy “Configure Windows Machines to be associated with a Data Collection Rule or a Data Collection Endpoint” on the resource group with your session hosts, point it to the Day 2 DCR and create a remediation task. New hosts from your scaling plan or image pipeline then get the association automatically.
Host pool diagnostic settings
The WVD tables only exist when the host pool sends its logs to the workspace. If you enabled Insights through the configuration workbook this is already done. If not, or if you want to be sure every log category is included, one command per host pool is enough:
$hostPool = Get-AzWvdHostPool -ResourceGroupName "rg-avd-hostpools" `
    -Name "hp-pooled-weu-01"

$logs = New-AzDiagnosticSettingLogSettingsObject -Enabled $true `
    -CategoryGroup "allLogs"

New-AzDiagnosticSetting -Name "diag-avd-day2" `
    -ResourceId $hostPool.Id `
    -WorkspaceId $WorkspaceResourceId `
-Log $logsImporting the workbook
Open Azure Monitor, go to Workbooks and create a new empty workbook. Open the Advanced Editor with the </> button, replace the content with the JSON from the package and select Apply. Save the workbook in the resource group of your monitoring resources, preferably as a shared workbook so your colleagues see the same thing. Select the workspace and host pool at the top and the tabs will start filling up. If a tab stays empty, go straight to the Data quality tab. It will tell you which source is missing.
Validate before you trust the charts
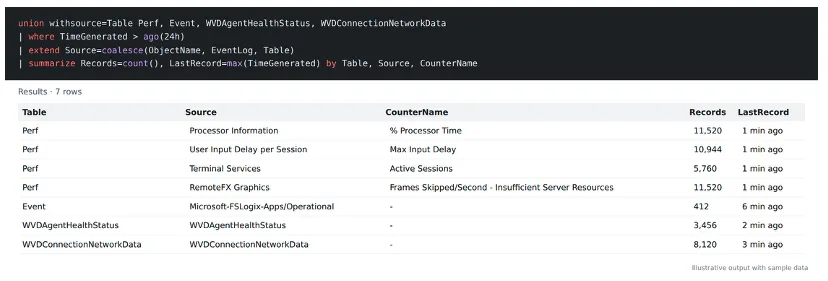
Just like in the Day 2 post, run these queries before you draw any conclusions. First, check that every counter and log the workbook depends on is arriving:
union withsource=Table Perf, Event, WVDAgentHealthStatus, WVDConnectionNetworkData
| where TimeGenerated > ago(24h)
| extend Source = coalesce(ObjectName, EventLog, Table)
| summarize Records = count(), LastRecord = max(TimeGenerated)
    by Table, Source, CounterName
| order by Table asc, Source ascSecond, check that every session host is sending a heartbeat:
Heartbeat
| summarize LastHeartbeat = max(TimeGenerated) by Computer
| extend MinutesOld = datetime_diff("minute", now(), LastHeartbeat)
| order by MinutesOld descThird, check that both DCRs are actually associated with your hosts. This is a Resource Graph query, not a Log Analytics query:
insightsresources
| where type == "microsoft.insights/datacollectionruleassociations"
| extend Vm = tolower(tostring(split(id, "/providers/Microsoft.Insights/")[0])),
         Dcr = tostring(properties.dataCollectionRuleId)
| where Vm contains "/virtualmachines/"
| summarize Rules = make_set(Dcr) by VmA session host with only one DCR in that list is a host with half a picture.
Alerts worth creating
A workbook is for people who are looking. Alerts are for when nobody is. I keep it to two log search alerts, because more alerts do not make an environment healthier, they only make people mute the channel. The first one fires when a session host has not been available for fifteen minutes:
WVDAgentHealthStatus
| where TimeGenerated > ago(15m)
| summarize arg_max(TimeGenerated, Status) by SessionHostName
| where Status != "Available"The second one fires when the P95 input delay on a host stays above your threshold. I start at 200 milliseconds and adjust after a few weeks of baseline data. Evaluate it every fifteen minutes over a thirty minute window, so a single slow application start does not wake anyone up.
Sampling, retention and cost
The Perf table is where the cost is. The math is simple: a counter sampled every 30 seconds produces 2,880 records per instance per host per day, at 60 seconds that is 1,440. Multiply that by the number of counters, the number of instances and the number of hosts, and you know what you are ingesting. Watch the wildcard counters in particular. User Input Delay per Process(*) creates an instance for every process on a busy multi-session host, and that adds up quickly. If you do not use per process input delay in your troubleshooting, removing it from the Insights DCR is the single biggest saving you can make, at the cost of a small gap in the Insights workbook.
For retention I use table level settings: 30 days interactive retention for Perf is usually enough for operational trends, while the WVD tables and Event are worth keeping a bit longer for troubleshooting patterns and audits. Check the Azure Monitor pricing page for your region before you decide, and start with pay as you go until you know your daily volume.
What this package does not try to do
It does not replace AVD Insights. It does not monitor the AVD control plane, which is Microsoft’s responsibility and is covered by Azure Service Health. It does not replace end user experience tooling that runs on the client, and it does not know anything about the applications inside the session. The thresholds in the workbook are starting points, not recommendations. A host pool for developers and a host pool for call center agents have very different definitions of “busy”, and your own baseline is always better than my defaults.
I think
Monitoring AVD is not about collecting more data. In most environments there is already plenty of data. It is about asking the right question first, and for session hosts that question is almost always the same: which host is making users unhappy right now, and is it the host, the network or the profile? The 2024 post made sure the data was there. This one tries to make it useful. Download the package, deploy it in a test host pool, give it two weeks of baseline and then adjust the thresholds to what normal looks like in your environment. And if you improve something, open a pull request. That is how version 2.1 gets written.
Download contents
The complete package is available on GitHub at github.com/GetToThe-Cloud/Website under AVD-Sessionhosts-Monitoring-2.0. It contains the Bicep templates in bicep/ (main.bicep with the DCR, association and alert modules, plus an example main.bicepparam), the compiled ARM templates in arm/, the workbook in workbook/avd-sessionhosts-monitoring-2.0.workbook.json together with the Python script that generates it, the deployment helpers Deploy-AvdDay2Monitoring.ps1 and Set-AvdHostPoolDiagnostics.ps1 in scripts/, and both query files in queries/: the validation queries from this post and the query behind every tab. The README covers the prerequisites, the permissions and the Azure Policy route.